How we determine bias and where we source information from.
The central goal of Stipulation is to provide citizens with proper context on important stories and advise readers on what reports are biased. To do so, we source dozens of news outlets to aggregate legitimate reporting. As a result, we are also able to determine if a report is biased relative to how different outlets are reporting on it. It is important to note that when we say bias, this is not our own perception of bias. In fact, we determine a report’s “biasness” based on quantitative percepts by average Americans.
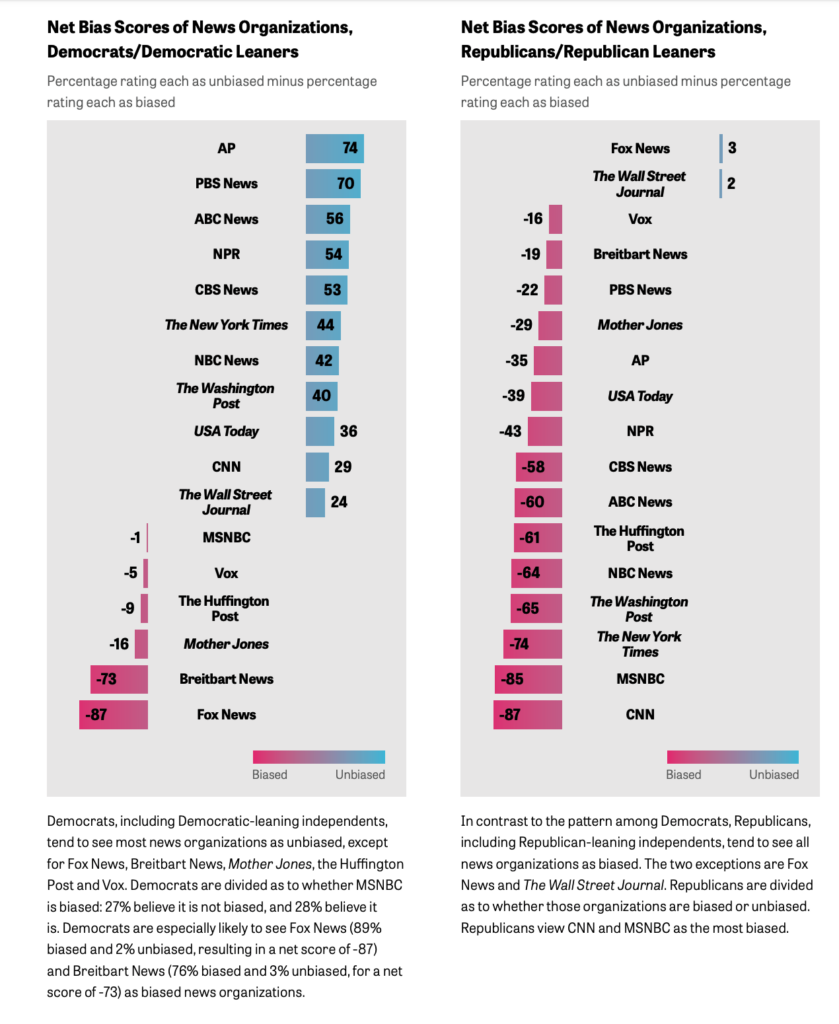
We use research on American’s perception of news outlet bias as our methodological foundation. Specifically, we use recent polling and analysis done by distinguished institutes to formulate a way to calculate a specific averaged bias score (ABS).
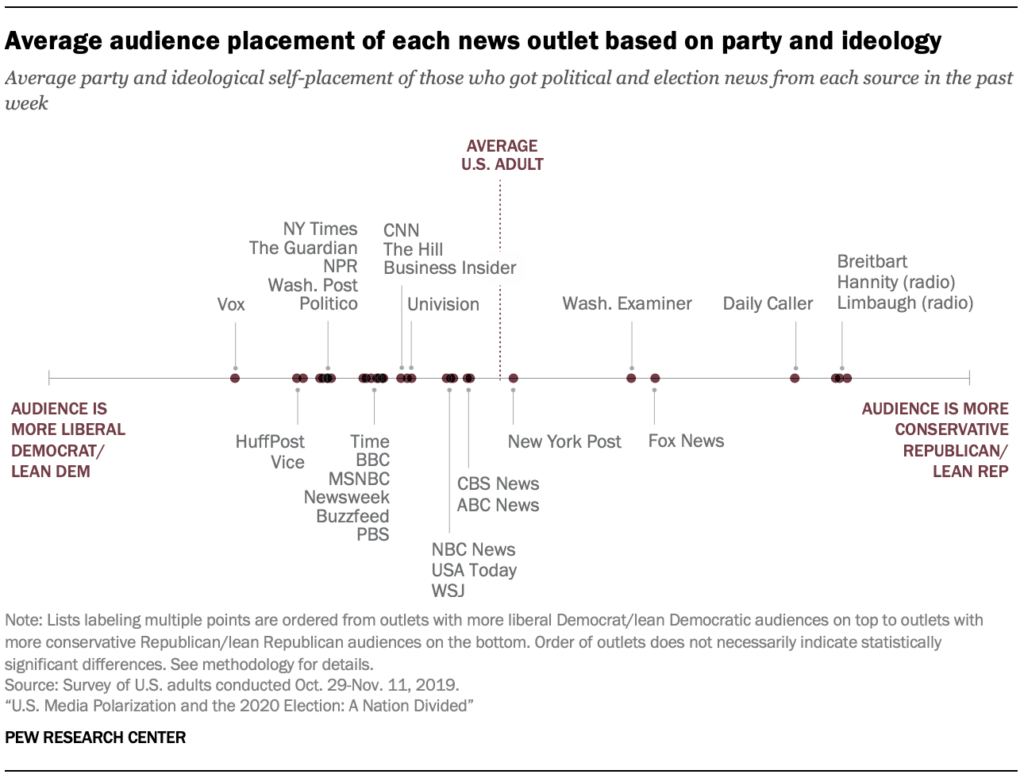
The research we used for our Stipulation ABS score comes from: Pew Research’s U.S. Media Polarization and the 2020 Election: A Nation Divided, Gallup/Knight Foundation’s Perceived Accuracy and Bias in the News Media (2018), and the RAND Corporation’s Truth Decay (2018).
Our Averaged Bias Score
The way we determine is by trying to remove any assumptions on our part and inputing simple values into our formula to get repeatable and verifiable results. The process, abridged, is as follows:
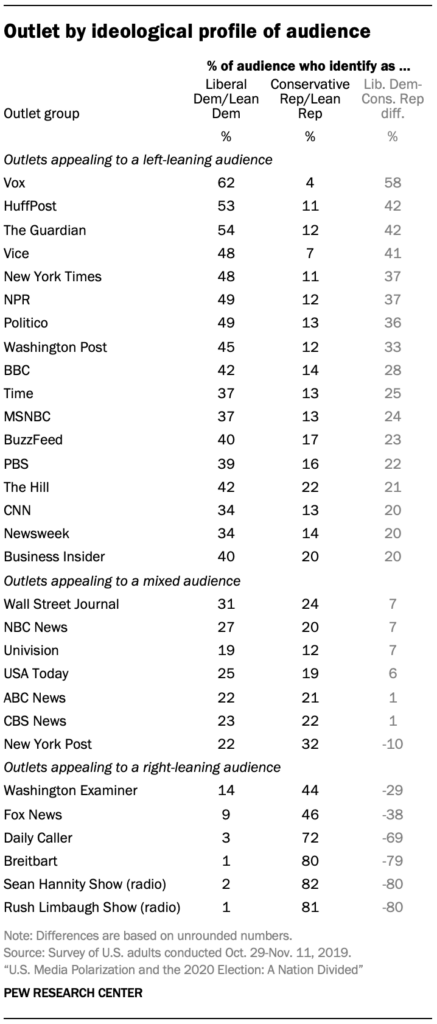
- We list out the 30 outlets used in the Pew study and assign them their “Liberal/Democratic to Conservative/Republican” differential. We include two similar quantitative perception scores from the Gallup/Knight survey so to improve outlet diversity.
- We take the percentage score and translate it to a real number by adding 100. This also eliminates negative differential scores.
- We then multiple the real number from step 2 by one, zero, or negative one. The number depends on whether the sourced reported is confirmed/reported by the outlet (multiplied by +1), or disputed/contradicted (multiplied by -1). If an outlet does not cover a report, takes a neutral position, or we cannot determine their stance, their score is multiplied by 0 and cancelled out.
- Once each of the 32 outlets has a total score, we average them altogether to get the final Averaged Bias Score (ABS).
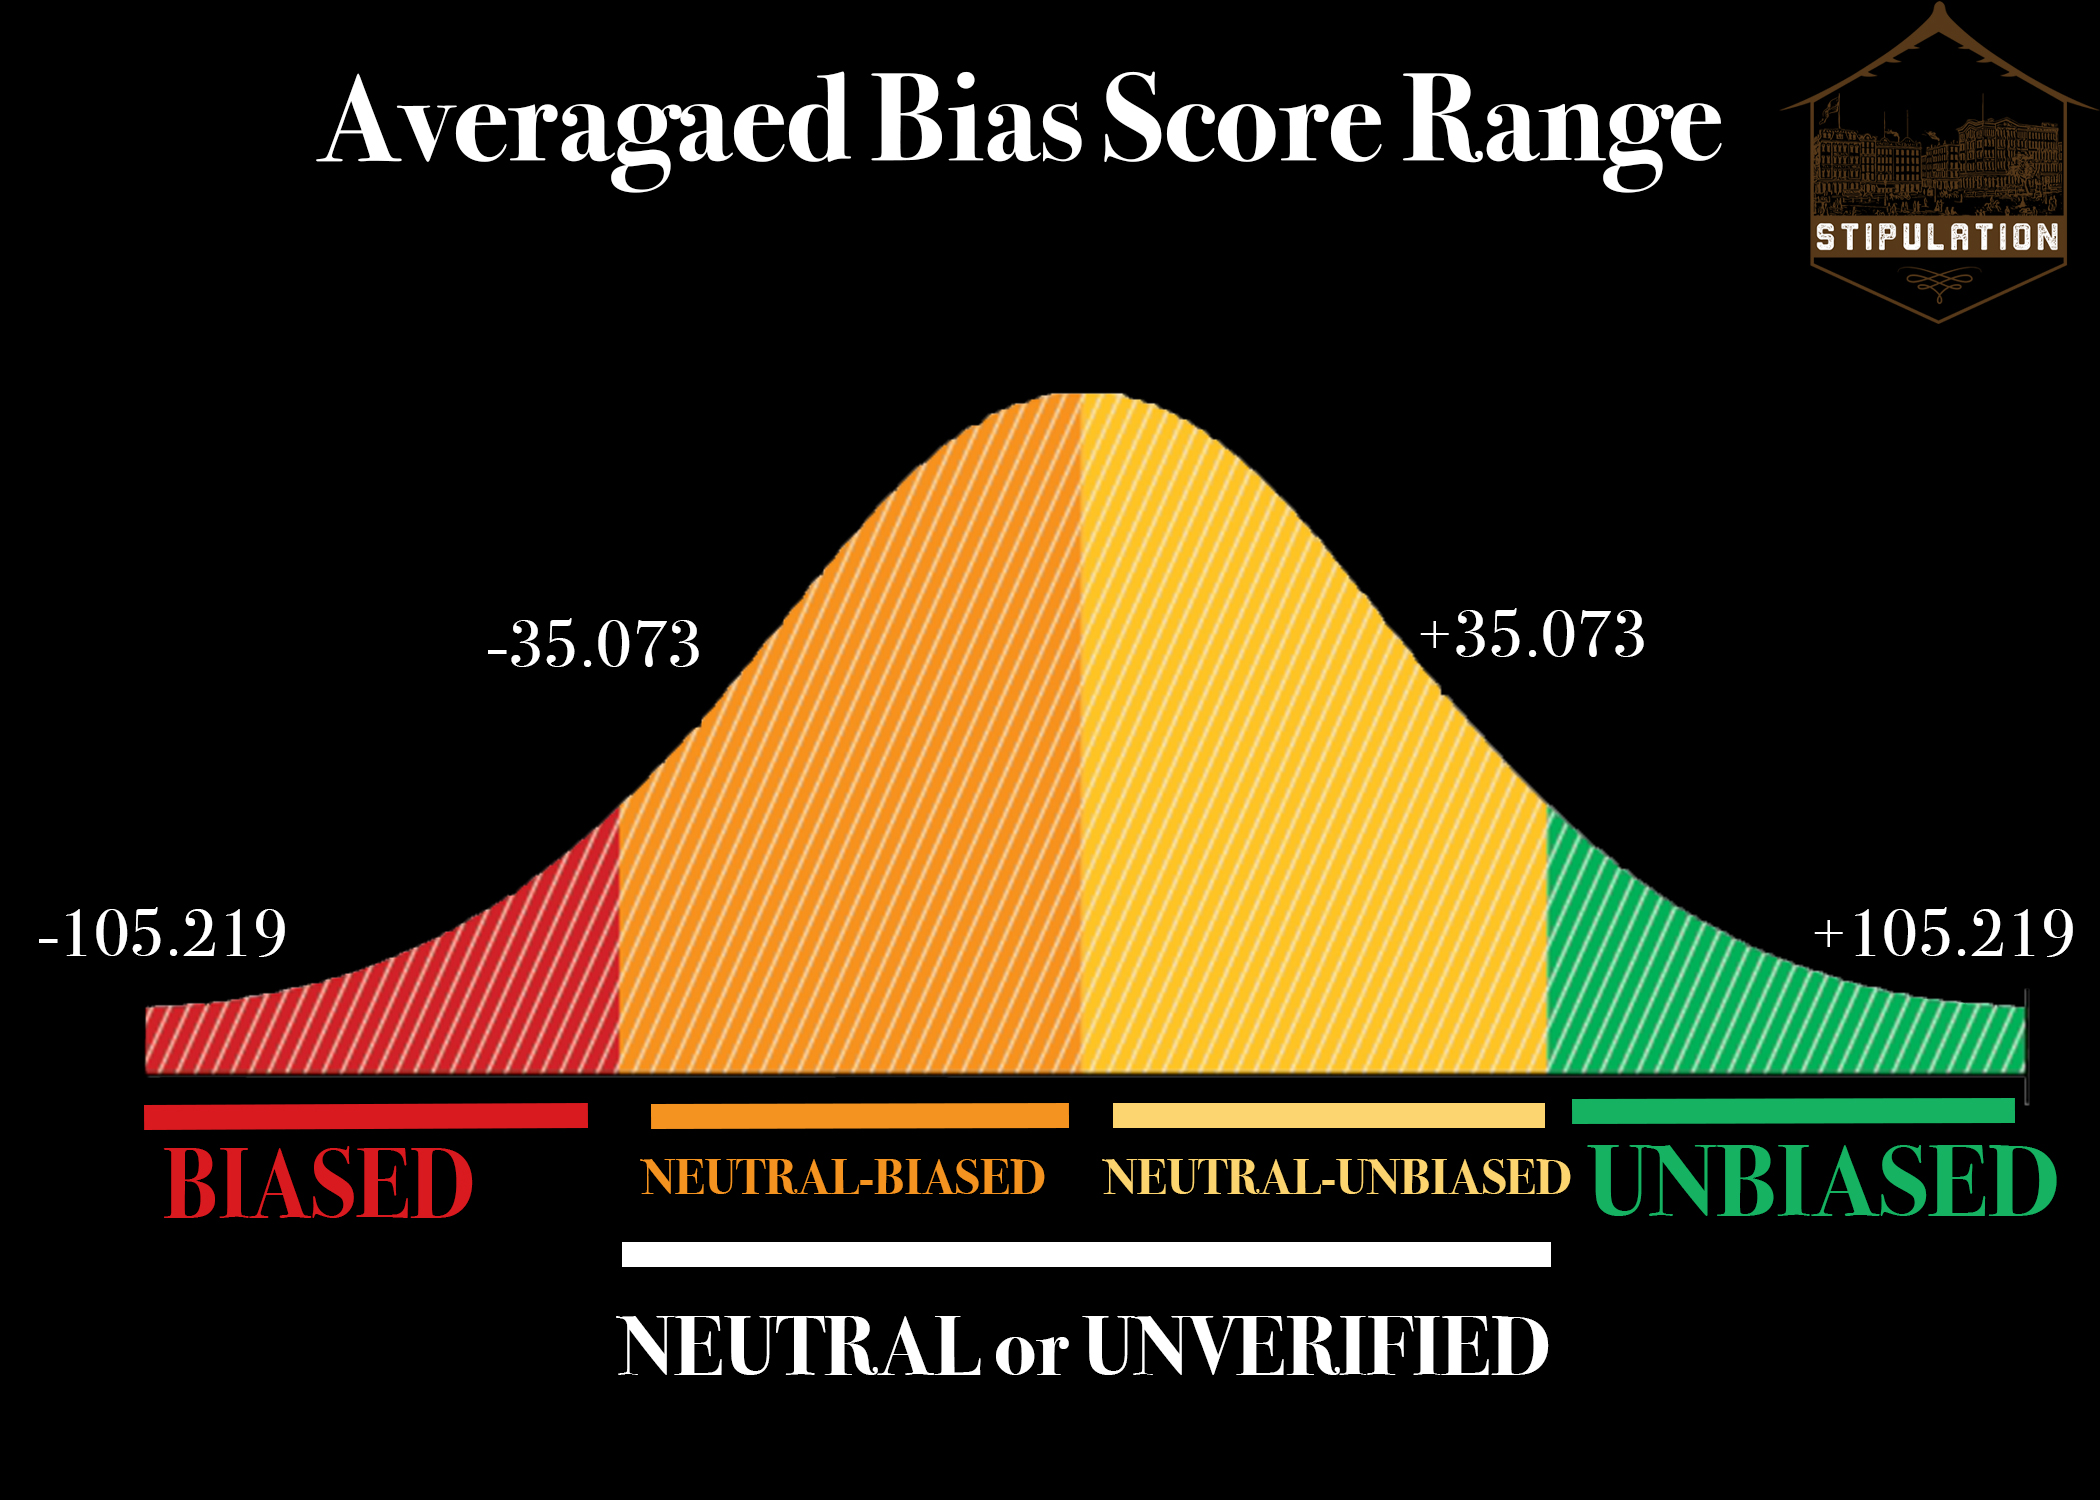
The extreme ends of the ABS continuum gives us two theoretical positions where a report is unanimously agreed to and unanimously disagreed to by the +30 news outlets.
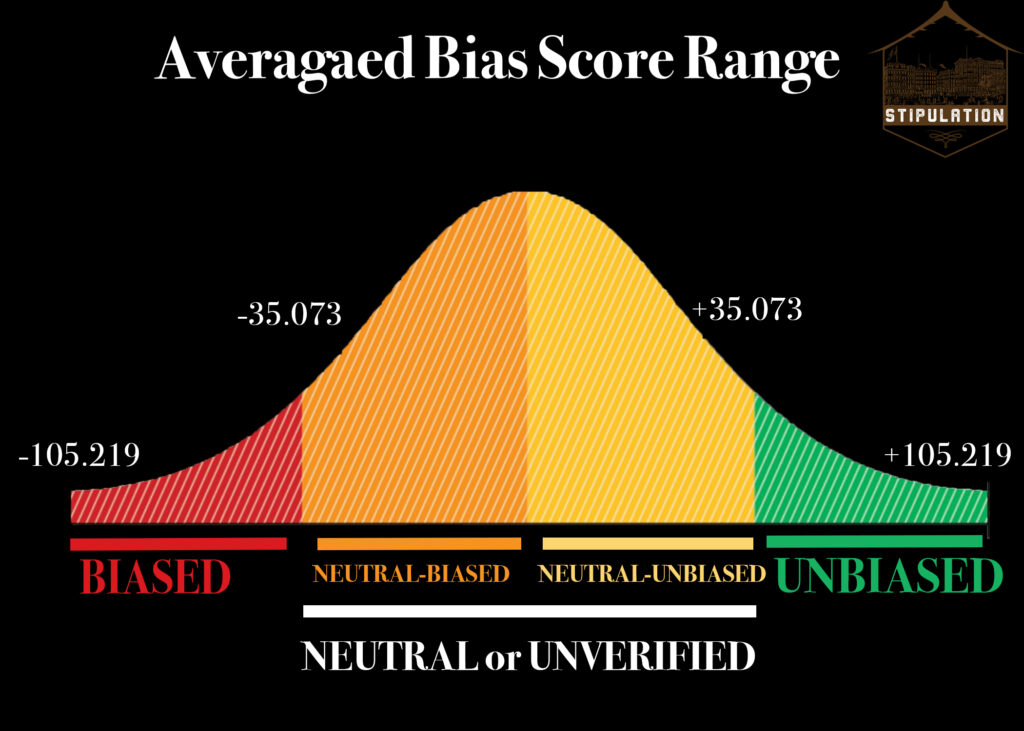
From the distribution curve above, we can determine where the ABS fall. Depending on the section (tertile), we can discern whether a selected report is relatively biased, neutral, or unbiased. That is to say, again, whether most outlets disagree with the report, are “neutral,” or agree with the report.
